Late Breaking Poster for EMC 2004 Antwerp
Transport of Intensity Equation applied to Atomic Resolution Images
Kazuo Ishizuka1, Brendan Allman2
1. HREM Research Inc, Matsukazedai, Saitama 355-0055, Japan
2. IATIA Ltd., Box Hill Nth, Vic. 3129, Australia
Keywords: Transfer of Intensity Equation, HREM, Phase measurement
Many samples in electron microscopy are phase objects as in the case of optical microscopy, which means that the phase change of the incident wave is quite strong, while the modulation of amplitude may be negligible. In optical microscopy Zernike phase plate is employed in order to convert the phase modulation into the amplitude modulation that can be recorded as intensity measurement. Unfortunately, it has been difficult to realize an equivalent phase plate in electron microscopy. Scherzer [1] showed a simple defocus produces an approximate phase plate in the presence of a spherical aberration. This imaging technique has been successfully used in electron microscopy.
About twenty years ago, Teague [2] derived an equation for wave propagation in terms of a phase and intensity under the small angle (paraxial) approximation, and showed that the phase may be determined by measuring only the propagating intensity.
![]() (1)
(1)
We call this equation the Transport of Intensity Equation (TIE). Van Dyck and Coene [3] obtained a similar equation in terms of a phase and amplitude instead of the intensity. In order to use the TIE we have to evaluate the differential of intensity along the wave propagation direction (z direction).
An accurate estimate of the intensity differential may be given by a difference of intensities measured at sufficiently close image planes. However, this is not possible in practice due to non-negligible noise on the images. Alas, the intensity difference with a large defocus step will give a poor estimate of the differential. We have analyzed this problem for the symmetric three-image case, where the three images are recorded with the same defocus distance. Let us analyze the wave function in Fourier space, because the effect of wave propagation in free space is simply described by a multiplication of a well-known defocus phase change. Then, the intensity differential with respect to z is simply given by
![]() (2)
(2)
On the other hand the expression of the difference for the symmetric case is given by
 (3)
(3)
It may be noted that all of the even order terms are cancelled out, and thus the difference may be a good approximation for the differential when the following condition is satisfied[4]:
![]() (4)
(4)
This gives a significantly larger defocus step of 6.9 nm for the same conditions assumed by Van Dyck and Coene [3]. This means that the TIE may be applicable even to atomic resolution images.
To demonstrate our prediction, we applied the TIE to atomic resolution images of Si3N4, which was obtained at NCEM [5]. Figure 1 shows a part of three images selected from the series of through-focus images. We used the software, QPt for DigitalMicrograph [6], which was developed based on the algorithm to solve the TIE proposed by Paganin and Nugent [7]. The reconstructed phase at the middle plane is shown in Fig. 2 (a). The top half of Fig. 2 (b) shows the phase back propagated to the specimen exit surface (zero-defocus), while the bottom half shows the phase corresponding to the minimum amplitude variation. Both of these phases in Fig. 2(b) are remarkably similar to the results reported by Ziegler et al. [5].
[1] O. Schrzer, J. Appl. Phys. 20 (1949) 20-29.
[2] M.R. Teague, J. Opt. Soc. Am. 73 (1983) 1434-1441
[3] D. Van Dyck, W. Coene, Optik 77 (1987) 125-128
[4] K. Ishizuka, B. Allman, Proc. 8APEM, Kanazawa (2004) 92-93.
[5] A. Ziegler, C. Kisielowski, R.O. Ritchie, Acta Materialia 50 (2002) 567-574.
[6] A TIE plug-in for DigitalMicrograph (Gatan), see www.hremresearch.com for details.
[7] D. Paganin, K.A. Nugent, Phys. Rev. Lett. 80 (1998) 2586-2589.
[8] The author greatly acknowledges Christian Kisielowsky for providing Si3N4 images and Les Allen for valuable information.
Figure 1 Three image intensities used for reconstruction. The defocus distance is 5.8 nm.
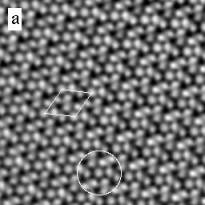
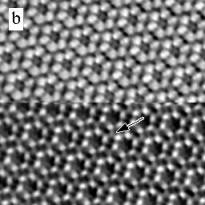
Figure 2 Reconstructed phases using QPt for DigitalMicrograph. (a) The phase at the middle plane. (b) The phase back propagated to the specimen exit surface (top), while the phase corresponding to the minimum amplitude variation (bottom). Nitrogen atoms that bridge the hexagonal rings can be clearly seen. A hexagonal ring and a unit cell are indicated in (a).